My Stats From 2011
As we roll into another year I thought it would be a good time to look back on various stats I have collected over the past year. Hopefully I will continue to do this at the beginning of every year as a way to document how things progress over time.
- I blogged here 9 times for a total of 3,208 words.

My blog was visited by 147,151 unique visitors generating 213,800 pageviews. Not bad considering I hardly update it anymore.- I scanned 454 receipts and spent at least $346.96 in sales tax.
- Kristina and I fully funded our IRAs (including starting and fully funding her 2010 IRA at the beginning of 2011). We also contributed to our 401K’s at work and managed to put away some money for a down payment on a house.
- We visited Paris and London this year.
- I managed to give 5 presentations (slides) to various DC Tech groups.
- Attended 7 conferences:
- UX Camp DC (1/8/2011)
- StartupXLR8R II (6/4 – 6/5/2011)
- Converge SE (6/24 – 6/25/2011)
- Mobile UX Camp DC (9/17/2011)
- Accessibility Camp DC (10/22/2011)
- An Event Apart DC (10/24 – 10/26/2011)
- WordCamp Philly (11/5 – 11/6/2011)
- I took 5,589 pictures, 728 of those were star-worthy in Picasa.
- I posted 111 mobile photos from my phone.
- 8.61 gigabytes of data used by my Nexus One on T-Mobile.

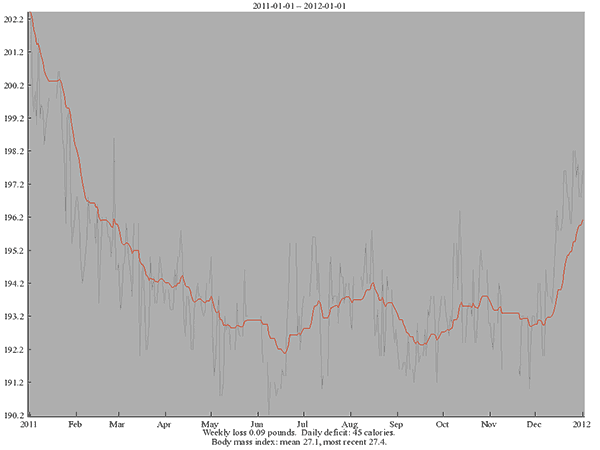
My average weight in 2011 was 194.3. My lowest weight was 192.1 (6/8/2011) and my highest was 202.4 (1/1/2011), so I ended the year lower than when I started.
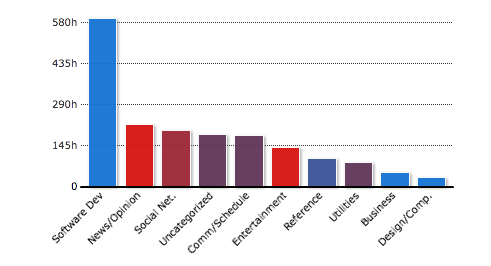
I spent 262 hours and 7 minutes in Dreamweaver writing code.- 159 hours and 28 minutes reading tweets, 15 hours and 24 minutes viewing Facebook, 6 hours and 4 minutes viewing Google+, and 5 minutes and 17 seconds viewing MySpace.
- 124 hours and 53 minutes was lost to email: 83 hours and 37 minutes in Outlook for work, 58 hours and 52 minutes in Gmail.
- 34 hours and 3 minutes searching Google.
Tools used to gather this data:
- TD Word Count plugin for blog word count stats.
- Google Analytics for various website stats.
- Picasa for organizing my photos.
- Hacker Diet Online where I keep track of my weight.
- Rescuetime.com for tracking which applications and websites I use.
Here’s to a number-filled 2012!

